Kids' Activities per Child: Australia's Best- and Thinnest-Covered Council Areas (2026)
Live listings refreshed 8 Oct 2026 · Last updated 8 Oct 2026
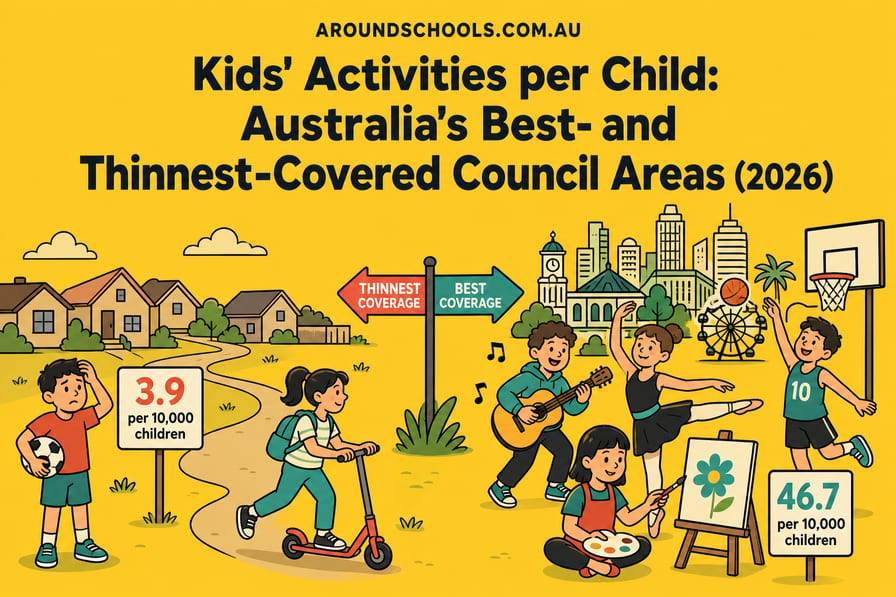
Across Australia's big council areas, the AroundSchools directory lists a median of about 10 kids' activity providers for every 10,000 children — but in Melbourne's Wyndham it is 3.9, and in the City of Melbourne it is 46.7. We divided the providers listed in each of Australia's 540 council areas by its number of children aged 0–14, using the Australian Bureau of Statistics' latest population estimates.
The pattern is consistent across cities. The council areas with the thinnest coverage are the outer suburbs where the most children live. Blacktown has 96,895 children and 46 providers listed; the City of Sydney has 16,275 children and 67.
Key takeaways
- The thinnest-covered big council area is Wyndham (Vic): 33 providers listed for 84,505 children, or 3.9 per 10,000.
- The outer suburbs dominate the thin list — Liverpool, Blacktown, Fairfield and Camden in Sydney; Wyndham, Melton and Casey in Melbourne; Wanneroo, Rockingham and Armadale in Perth.
- Inner-city councils have the most per child, led by the City of Melbourne (46.7) and the City of Sydney (41.2). Many of those providers also serve children from across the city.
- Within Melbourne, the best- and thinnest-covered council areas are 12 times apart. In Sydney the gap is almost 10 times.
- This measures what is listed in our directory, not every activity that exists. Read the comparisons within a city, not between states.
Best-covered and thinnest-covered council areas
Kids’ activity providers per 10,000 children aged 0–14
Best covered (councils with 10,000+ children)
Melbourne (VIC)
47 providers · 10,073 children
46.7
Sydney (NSW)
67 providers · 16,275 children
41.2
Mitcham (SA)
38 providers · 11,795 children
32.2
Port Phillip (VIC)
37 providers · 11,573 children
32.0
Charles Sturt (SA)
61 providers · 19,388 children
31.5
Thinnest covered (councils with 20,000+ children)
Wyndham (VIC)
33 providers · 84,505 children
3.9
Liverpool (NSW)
23 providers · 54,215 children
4.2
Wanneroo (WA)
21 providers · 49,382 children
4.3
Rockingham (WA)
14 providers · 31,572 children
4.4
Blacktown (NSW)
46 providers · 96,895 children
4.7
So what: the thinnest-covered large councils are nearly all fast-growing outer suburbs — Wyndham has 84,505 children and 33 providers listed.
Based on Australian Bureau of Statistics data (ERP, 30 June 2024) · AroundSchools directory, October 2026
Which council areas have the most kids' activities per child?
The best-covered council areas are inner-city and established middle-ring areas, plus a strong run of Adelaide councils. The table covers council areas with at least 10,000 children, so a small area with a handful of providers cannot top the list.
| Rank | Council area | State | Providers per 10,000 children | Providers listed | Children aged 0–14 | Schools |
|---|---|---|---|---|---|---|
| 1 | Melbourne | VIC | 46.7 | 47 | 10,073 | 22 |
| 2 | Sydney | NSW | 41.2 | 67 | 16,275 | 46 |
| 3 | Mitcham | SA | 32.2 | 38 | 11,795 | 24 |
| 4 | Port Phillip | VIC | 32.0 | 37 | 11,573 | 23 |
| 5 | Charles Sturt | SA | 31.5 | 61 | 19,388 | 34 |
| 6 | Yarra | VIC | 30.0 | 30 | 10,009 | 31 |
| 7 | Onkaparinga | SA | 26.4 | 84 | 31,855 | 64 |
| 8 | Willoughby | NSW | 26.2 | 35 | 13,347 | 17 |
| 9 | Marion | SA | 26.1 | 42 | 16,070 | 29 |
| 10 | Tea Tree Gully | SA | 23.7 | 42 | 17,690 | 32 |
Inner-city councils score highly partly because they have relatively few children for the number of providers. A swim school or dance studio in the City of Melbourne serves families from all over the city, so its number per local child overstates what is on offer to any one family.
Which council areas have the fewest?
The ten thinnest-covered big council areas are all outer-suburban, and between them they hold some of the largest child populations in the country. This table covers council areas with at least 20,000 children.
| Rank | Council area | State | Providers per 10,000 children | Providers listed | Children aged 0–14 | Schools |
|---|---|---|---|---|---|---|
| 1 | Wyndham | VIC | 3.9 | 33 | 84,505 | 73 |
| 2 | Liverpool | NSW | 4.2 | 23 | 54,215 | 76 |
| 3 | Wanneroo | WA | 4.3 | 21 | 49,382 | 67 |
| 4 | Rockingham | WA | 4.4 | 14 | 31,572 | 48 |
| 5 | Blacktown | NSW | 4.7 | 46 | 96,895 | 127 |
| 6 | Melton | VIC | 4.7 | 25 | 53,280 | 57 |
| 7 | Fairfield | NSW | 4.8 | 17 | 35,408 | 54 |
| 8 | Armadale | WA | 4.8 | 12 | 25,149 | 39 |
| 9 | Camden | NSW | 5.1 | 18 | 35,313 | 36 |
| 10 | Casey | VIC | 5.2 | 47 | 89,562 | 102 |
Blacktown, Casey and Wyndham are three of the seven council areas in Australia with the most children aged 0–14 — and each has between 3.9 and 5.2 kids' activity providers listed per 10,000 children.
These are also council areas with large numbers of schools — Blacktown has 127, Casey 102. The gap is not in schools. It is in after-school and weekend activities that families can find listed in one place.
How does your city compare, council by council?
Inside each city the gap is wide, and it runs from the inner city out to the growth suburbs. Comparing councils within one city is the fairest reading of this data, because our directory's coverage is broadly similar within a city.
| Metro area | Councils compared | Whole metro | Best covered | Thinnest covered |
|---|---|---|---|---|
| Sydney | 23 | 9.2 | Sydney 41.2 | Liverpool 4.2 |
| Melbourne | 28 | 11.7 | Melbourne 46.7 | Wyndham 3.9 |
| Perth | 12 | 8.3 | Joondalup 12.3 | Wanneroo 4.3 |
| Adelaide | 8 | 21.7 | Mitcham 32.2 | Playford 7.1 |
Brisbane is left out of this table because Brisbane City Council covers most of the city on its own — 221,767 children and 298 providers listed, or 13.4 per 10,000. Its neighbours Logan (6.6) and Redland (10.2) both sit below it.
Why do the states look so different?
Most of the difference between states reflects how complete our directory is in each state, not how much there is for children to do. South Australia shows 25.4 providers per 10,000 children; every other state and territory sits between 9.4 and 13.1.
Kids’ activity providers per 10,000 children, by state
Providers listed in the AroundSchools directory ÷ children aged 0–14 (ABS, June 2024)
SA
790 providers · 311,515 children
25.4
NT
65 providers · 49,761 children
13.1
TAS
118 providers · 92,693 children
12.7
VIC
1,371 providers · 1,216,442 children
11.3
WA
534 providers · 542,854 children
9.8
QLD
969 providers · 1,005,953 children
9.6
NSW
1,408 providers · 1,488,830 children
9.5
ACT
78 providers · 82,754 children
9.4
So what: South Australia’s lead mostly reflects how complete our directory is there, not more for kids to do — compare councils within a city, not states with each other.
Based on Australian Bureau of Statistics data (ERP, 30 June 2024) · AroundSchools directory, October 2026
So read the state figures as a measure of where AroundSchools has mapped more providers, and compare council areas within the same city. Our note on how we count kids' activities explains what is and is not counted.
What this means for families
- If you live in a thin-coverage area, look one council over. Families in Wyndham or Melton often use providers in neighbouring areas. Each council page lists the providers, schools and events we have mapped.
- Ask your council what it runs. Councils run libraries, leisure centres and holiday programs that may not be listed as providers. Your council page lists the libraries, parks and community centres we have mapped.
- Use the voucher your state offers. Most states fund part of a child's sport or activity fees — see kids' activity vouchers by state.
What this means for councils and providers
- For councils: the per-child figure is a starting point for a conversation, not a verdict. If your area is thin here but rich in reality, the fastest fix is helping local clubs and providers list.
- For providers: the thin-coverage areas are where families are least able to find you, and where there are the most children. Listing is free through the AroundSchools business portal.
How we calculated it
- Children: the number of children aged 0–14 in each council area, from the Australian Bureau of Statistics' Estimated Resident Population by local government area, 30 June 2024 (ages 0–4, 5–9 and 10–14 added together). We used 0–14 because those are exact ABS age groups; a 0–17 figure would need an estimate.
- Providers: active kids' activity providers in the AroundSchools directory, placed in a council area by their location — sports clubs, swim schools, music, dance, tutoring and similar. Parks, libraries and other public facilities are counted separately and not included. Figures as at 8 October 2026.
- The measure: providers ÷ children × 10,000. The top list covers council areas with at least 10,000 children; the thin list, at least 20,000. Metro comparisons use council areas with at least 10,000 children whose centre lies within 35–50 km of the city centre.
- The ACT is one area for this purpose, because it has no local councils.
Limitations
- This measures our directory, not the real world. A provider we have not mapped is invisible here. The state comparison in particular reflects where our directory is more complete.
- People cross council lines. A council's figure says nothing about the providers just over its border.
- Providers vary in size. A club with 600 members and a solo tutor each count as one provider.
- Population and providers are from different dates — children as at June 2024, providers as at October 2026.
To cite this: "AroundSchools, Kids' Activities per Child by Council Area (2026), based on Australian Bureau of Statistics data and the AroundSchools directory, October 2026." Please link to this page.
Frequently asked questions
Which council area has the most kids' activities per child?
Among council areas with at least 10,000 children, the City of Melbourne has the most providers listed per child: 46.7 per 10,000 children. The City of Sydney is next at 41.2.
Which council area has the fewest?
Among council areas with at least 20,000 children, Wyndham in Melbourne's west has the fewest providers listed per child: 3.9 per 10,000 children, or 33 providers for 84,505 children.
Does a low figure mean there is nothing for kids to do?
No. It means few providers are listed in our directory relative to the number of children. Some areas have more on offer than we have mapped yet, and families often travel to neighbouring council areas.
Why is South Australia so far ahead?
Mostly because our directory is more complete in South Australia. Compare council areas within one city rather than states with each other.
Where does the child population figure come from?
The Australian Bureau of Statistics' Estimated Resident Population by local government area, 30 June 2024, ages 0–14.
Related reading
- Best councils and suburbs for kids' activities in Australia
- Best suburbs for families in Australia
- Kids' activity vouchers by state
- The Kids' Activity Index
Based on Australian Bureau of Statistics data (Estimated Resident Population, 30 June 2024) and the AroundSchools directory as at 8 October 2026.